
As I watch CNBC on the television in my office and read articles on the internet, I find myself pondering how efficiently, or better said, rationally the equity market is behaving. The flood of liquidity from the Fed and massive government bailouts have pushed the broad equity indices to levels that are completely dislocated from the economic realities of 2020. To a certain degree it does make sense as the stock market generally bottoms well before the end of a recession. This is because the stock market looks into the future to estimate companies’ ability to generate cash and profits.
In my commentary from March 18th, I noted that corporate cash flows in aggregate should not be materially impacted in 2021 and beyond. Last week, I said that I am firmly in the camp that 2021 will see economic output get back close to 2019 levels. But my views are tilted by an inherent optimism that the Covid-19 crisis will pass, and that things will get back to as close to normal as possible by the end of the year. But there remains the risk that the crisis lingers longer, that unemployment remains elevated post-crisis, and that structural damage to the economy inhibits growth. These risks should be factored into equity market prices.
As I dig through the year-to-date numbers, I find that while the iShares Core S&P 500 ETF (IVV) is down 11.21% through May 6th, the iShares Core S&P US Value ETF (IUSV) is down 21.25%, and the iShares Core S&P Growth ETF (IUSG) is only down 3.90%. This should not come as a huge surprise as all the non-coronavirus headlines are about the digitization of the economy and how well tech stocks are doing. But it raises some concerns. The cheap has gotten cheaper and the expensive has gotten more expensive. One side of the market is pricing in the bad, while the other is pricing in the good. Per YCharts, IUSV has a weighted average P/E ratio of 14.72 while IUSG is at 26.03. The forecasted P/E ratios are 16.02 and 26.66, respectively.
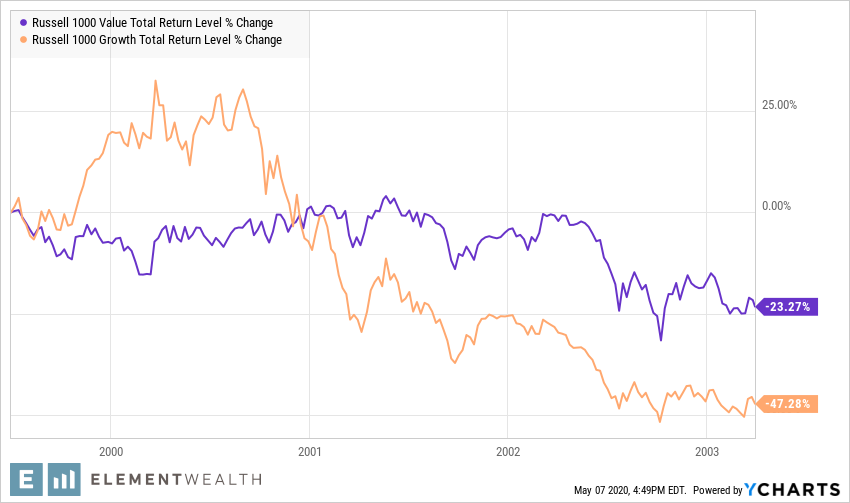
This is not the first time that market has become bifurcated. In the summer of 1999, the Russell 1000 Value Index stalled while the Russell 1000 Growth Index rallied another 32%. Everyone knows what happened next.
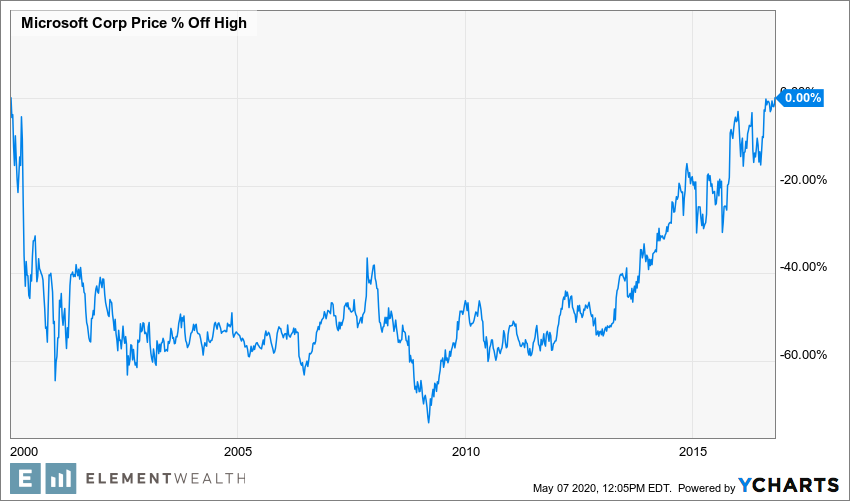
I will be the first one to say that this is not the Tech Bubble and I do not foresee an 80% decline, or even a 40% decline, in the Nasdaq. However, I do think there are lessons to learn. The chart below illustrates the decline in Microsoft during the Tech Bubble and how long it took to get back to all-time highs. It took until the fall of 2016 for Microsoft to get back to the same level it traded at in 2000. That is over 16 years. For the fiscal year ending June 30, 2000, Microsoft earned $0.8903 per share. For the fiscal year ending June 30, 2016, it earned $2.56. That is a 288% increase in earnings (6.8% per year) and no gain in the stock.
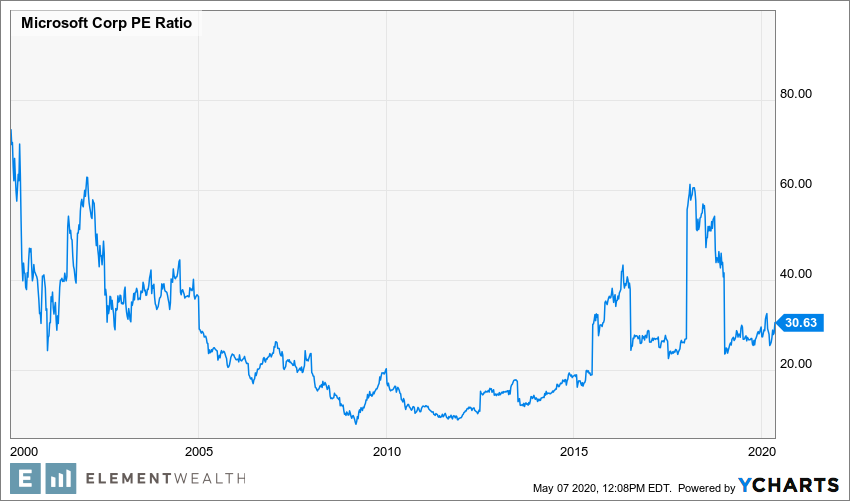
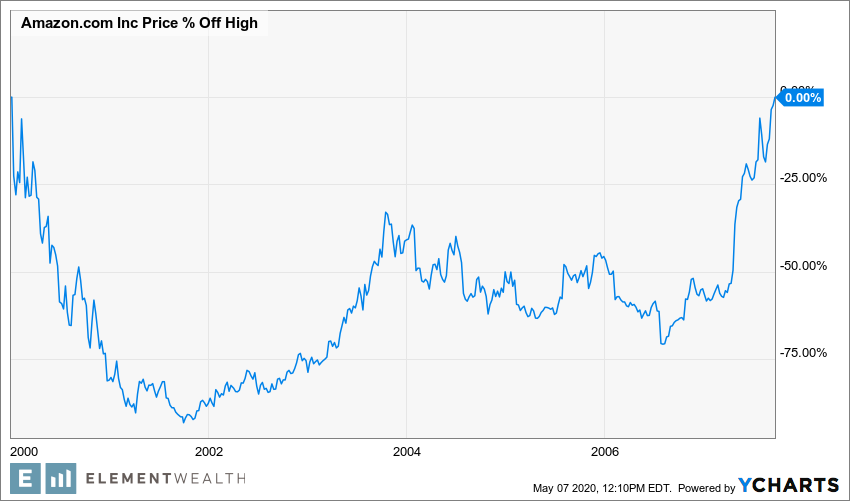
In 2000, Microsoft was a profitable company with a lot of earnings growth ahead of it. Unfortunately, the stock price in 2000 was too optimistic and it took a long-time to grow into its valuation. At the same time Amazon was an up and coming company that did not make money. For the fiscal year ending 12/31/1999, Amazon lost $2.20 per share. It took over 7 years for Amazon to get back to its 2000 level. What happened next is one of the greatest stories in stock market history!
The point here is that expectations are high for many companies. We do not know who the next Microsoft or Amazon will be. Which company will continue to grow earnings but watch its valuation erode causing it to go nowhere? Which young expensive company will live up to the hype and alter industries?
Below are some of the most frequently talked about companies and their respective valuation metrics and then a summary of their earnings over the past four years.
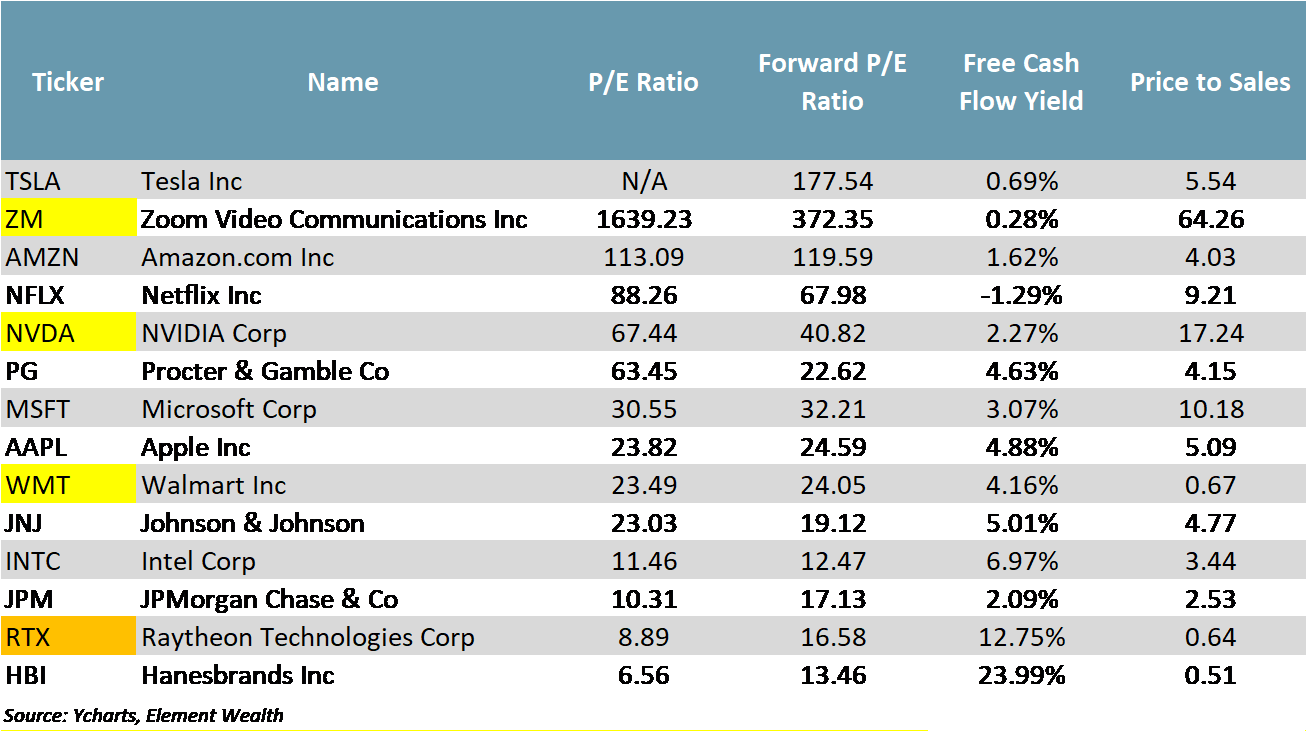
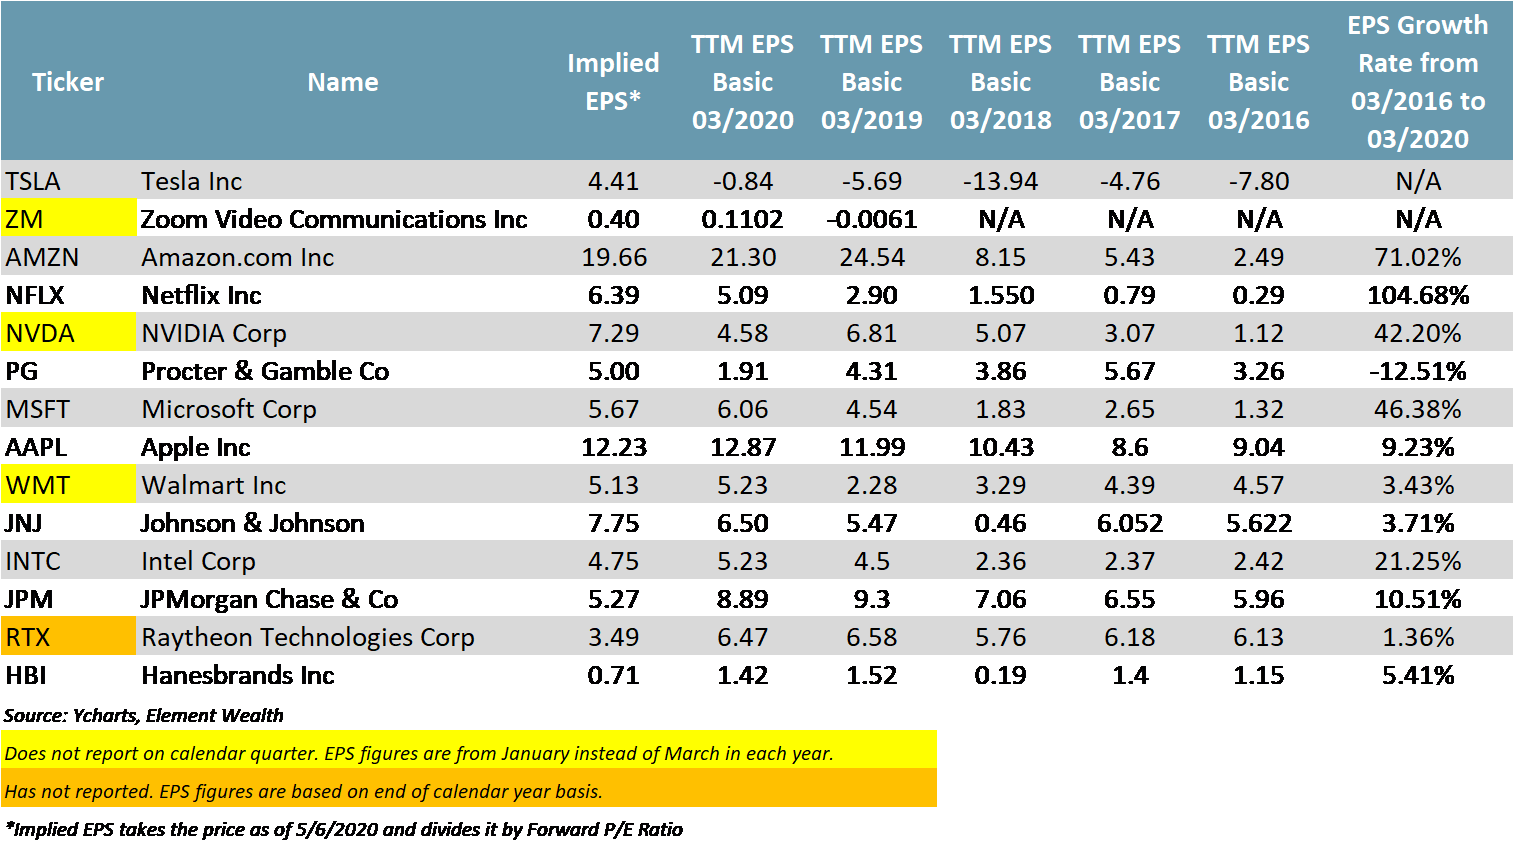
Based on today’s valuations, investors are paying a hefty premium for potential growth. They are also paying up for the biggest most stable companies. Everything else appears to be pricing in a challenging environment.
One final thought is about Warren Buffett. It was very interesting to hear that Berkshire Hathaway had not deployed its cash reserve during the market decline. Some in the media have pointed to his underperformance and divestitures (at a significant loss) of Berkshire’s interest in the airlines as the end of an era. Although, I believe that the world is changing, I do not believe that his investment principals are any less relevant today than any other time. The one thing that he has is patience and he is an investor, not a trader. Only time will tell, but when questioned in the past, his methods have been proven to be right.
Be sure to send us your questions here and don’t forget to connect with us on Facebook and LinkedIn.
Stay safe!
Jeremy Nelson, Partner
Element Wealth, LLC (EW) is an investment adviser registered with the Securities and Exchange Commission (SEC). EW only transacts business in states where it is registered, or where an exemption from registration is available. Registration as an investment adviser does not constitute an endorsement of the firm by the SEC, nor does it indicate a particular level of skill or ability. Past performance is not indicative of future results, and investors should realize that investing in securities involves risk of loss. Money invested in securities is not guaranteed against such loss by any governmental or non-governmental organization. EW is not a law or accounting firm, and does not give legal, accounting or tax advice.